 |
| Home | Overview | Background | Assessment Method | Assessment Tool | Download | Statistics | Link |

Structure of CASBEE assessment software
To operate
the system, the assessor fills out two assessment forms at each design
stage: the Main Sheet and the Score Sheet.
The assessment results for each assessment items are given as scores for
Q; Built Environment Quality and LR; Reduction of Built Environment Load
on the Score Sheet.
Here the indicator LR is assessed, representing not the L: Built Environment
Load itself, but the level of performance in minimizing built environment
load imposed outside the hypothetical boundary.
The Assessment Result Sheet mainly displays the result of the assessment
of a building using CASBEE.
Assessment
Result Sheet |
Score
Sheet |
Score Sheet
Assessment
categories
The sheet is divided into sections representing the assessment categories
indicated below. Based on the restructure of assessment items, Q (Built
Environment Quality) is broken down into three categories of Q1 (Indoor
Environment), Q2 (Quality of Service) and Q3 (Outdoor Environment on Site).
LR (Reduction of Built Environment Load) is also sub-grouped into LR1
(Energy), LR2 (Resources& Materials) and LR3 (Off-site Environment).
Scoring
Scores are given based on the scoring criteria for each assessment item.
These criteria applied to assessments are determined taking into consideration
of the level of technical and social standards at the time of assessment.
A five-level scoring system is used, and a score of level 3 indicates
an "average".
Weighting
Each assessment item, such as Q1, Q2 and Q3, is weighted so that all the
weighting coefficients within the assessment category Q sum up to 1.0.
The scores for each assessment item are multiplied by the weighting coefficient,
and aggregated into SQ; total scores for Q or LR; total scores for LR
respectively.
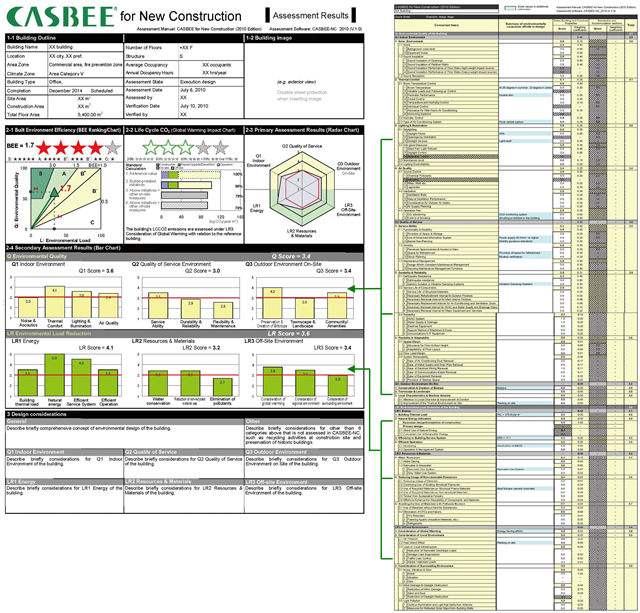
Assessment Result Sheet
(1)
Project Outline
The outline of the assessed building is presented in the sheet, including
such information as building type, location, floor area of the building.
(2) Result
of CASBEE
(2)-1 Results by category
These are summarized in the form of a radar chart, bar graphs and numerical
values.
(2)-2 BEE (Built Environment
Efficiency)
Information on BEE as calculated from the results of Q and L is displayed.
In CASBEE, assessment scale for Q and LR ranges from 1 to 5.
As SQ represents the score of Q category, the numerator Q is derived from
SQ. Similarly, the denominator L is calculated from SLR.
The definition of BEE is indicated below.
BEE= Q / L = 25*(SQ-1) / 25*(5-SLR)
SQ= Score for Q category
SLR= Score for LR category
BEE is presented as
a graph on the left, with Q on the Y axis and L on the Y axis, so that
BEE is the gradient of the line joining the point with coordinates equal
to the Q and L values to the origin (Q=0, L=0).
The higher the Q value and the lower the L value, the steeper the gradient
and the more performance assessment classification from C (poor) through
B-, B+, A and S (excellent), corresponding to regions
divided according to the line gradient.
(3) Important
assessment items excluded from comprehensive assessment for building environmental
efficiency
This is the column to enter indicators which are not included in assessment
under (2), but which are important for building environmental performance
assessment.
(3)-1 Quantitative
assessment indicators for typical building environmental loads
Calculate and enter the results for primary energy consumption in operation,
water consumption volume and LCCO2 etc. The figures displayed here are
representative quantitative values for building environmental performance
assessment. If possible, the evaluated building and a standard building
may be compared and a reduction value and reduction rate indicated for
each assessment value. Enter the above on completion of the Execution
Design Stage, and on completion of the Construction Completion Stage.
For the time being, the assessor can select a suitable LCA method for
the assessment process from among the various published LCA methods.
(3)-2 Design process
assessment
This is the area for checking items that are important environmental considerations
in building management (CM etc.), mainly as program. Check matters such
as whether there is an environmental management plan for the construction
site. However, assessment of items relating to site selection is excluded
from consideration as they are handled by CASBEE for Pre-design.
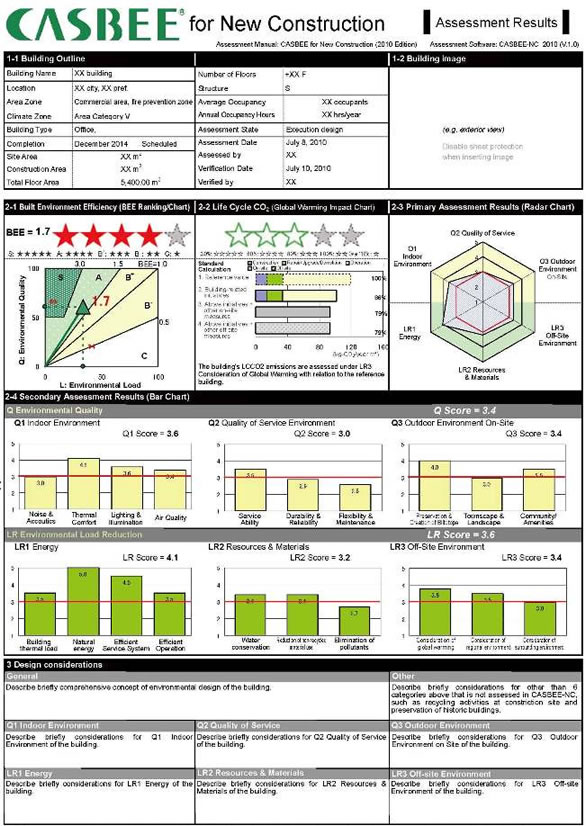
Figure 8. Assessment Result Sheet
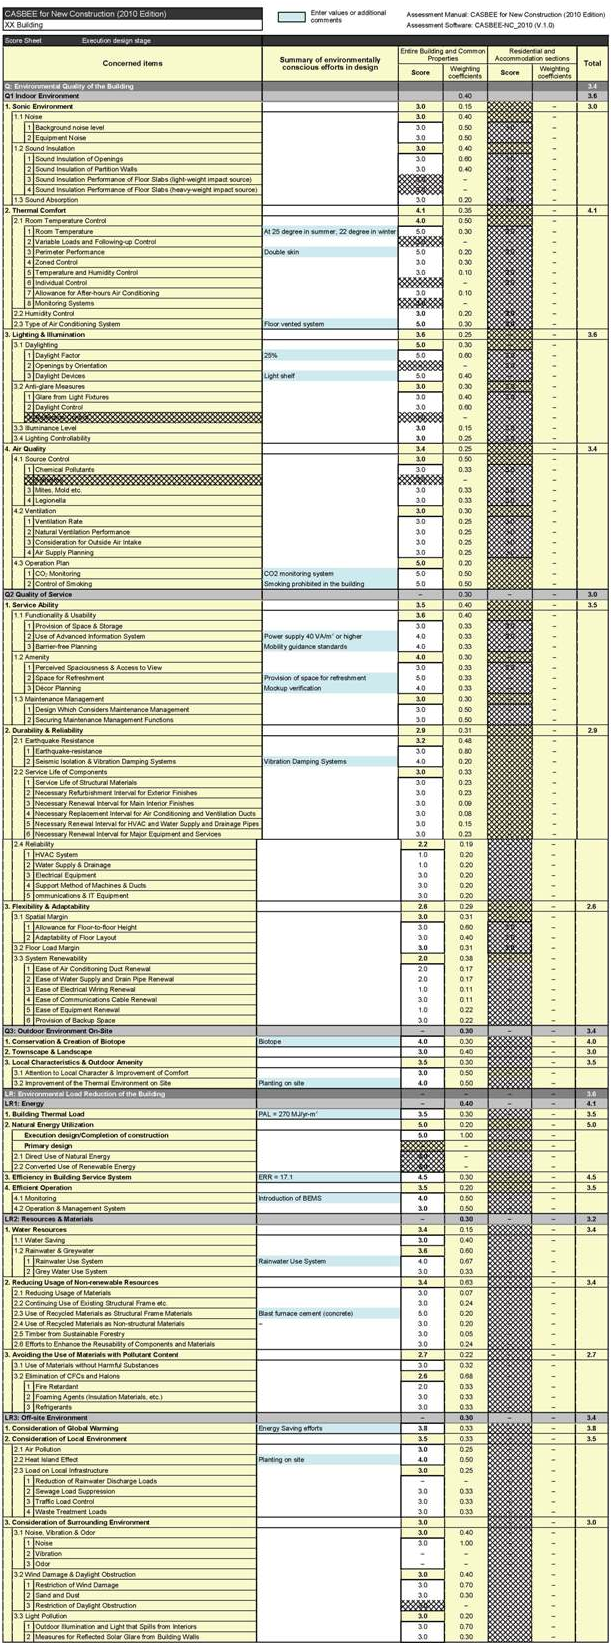
Figure 9. Score Sheet
All Rights Reserved.